The paths of customers are inscrutable …. or at least difficult to understand. Time and again there are weeks when users ask if something was wrong with the shop, e.g. because there were fewer orders than expected. From the point of view of our system monitoring, we see “global” events, such as the end of a beautiful summer day or the rush to the shop during a half-time break. But at the shop level, there are of course too many influencing variables, from local holiday periods to promotions, so the most we can do is provide comparative information.
A small line has been added to the billing area of the shop admin area:
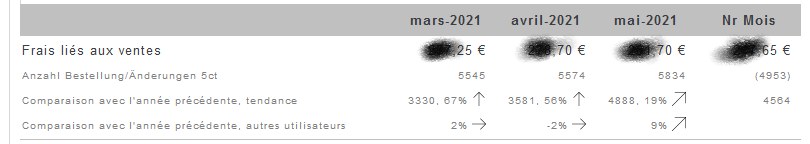
It is still not easy to compare business figures with the previous year, but the jumps in the 1st corona wave in Germany from March 2020 continue to confuse simple reports.
By the way, April 2021 was the first month in many years in which we (as a user community? As an industry? ) fell short of the figures for the same month last year – no wonder given the increase last year:
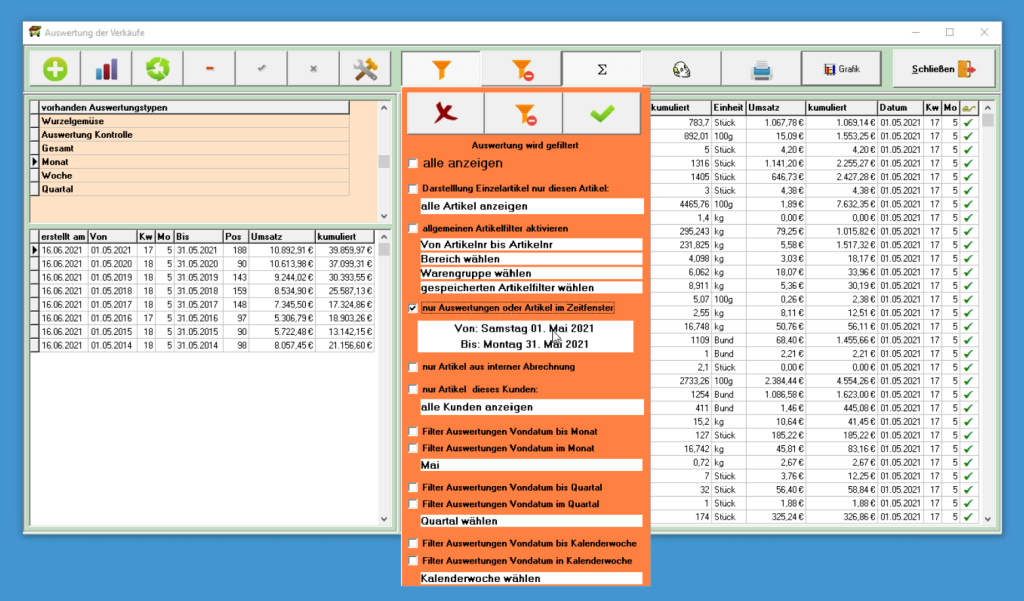
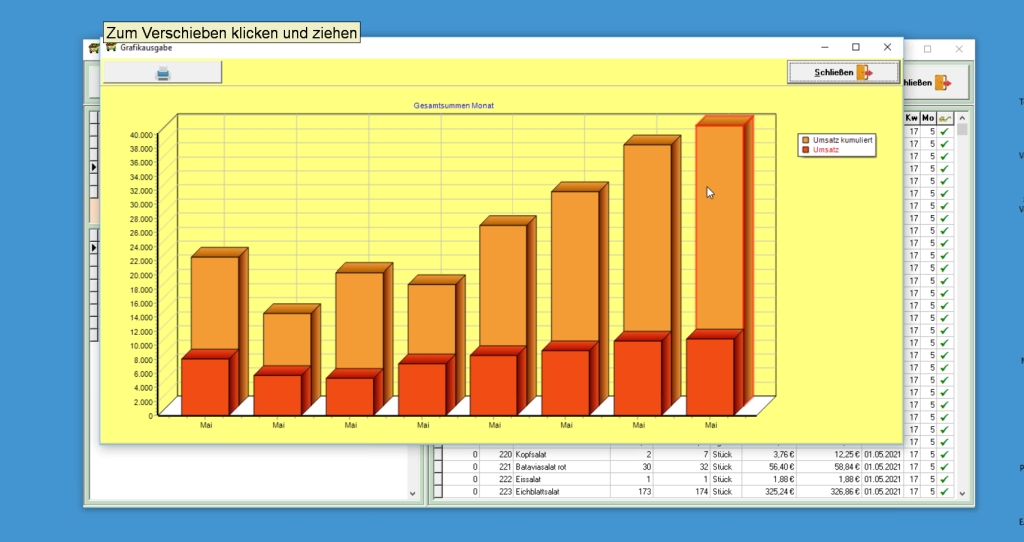
Soon there will also be new evaluation options in the PCG, here are a few first screenshots: