For all of us, March is the anniversary of a sudden increase in sales.
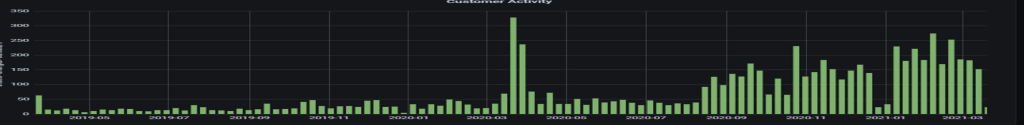
What next? Perhaps the “incidences” tell us something. First of all, we appreciate that the first wave brought us the highest number of visitors; unfortunately, the October wave did not have the same effect.
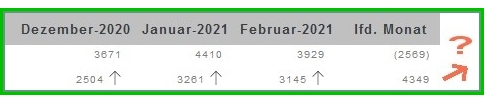
The annual cycle has little changed: March has always been the strongest month. In 2020, however, it has risen considerably while drops at Easter and the summer holiday period have remained similar. Only the peak before Christmas shows that there was less mobility after all.
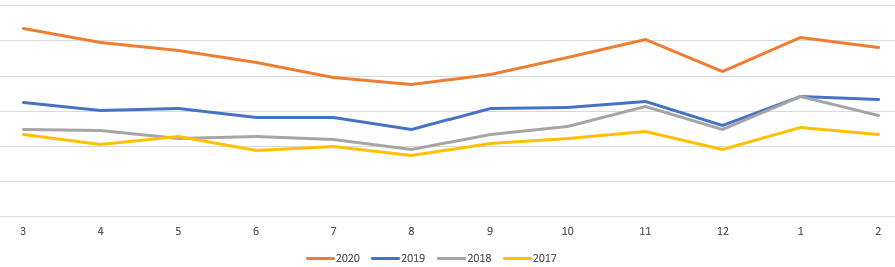
The growth of the last few years also seems to continue despite the Covid.
The permanent arrival of new customers appears to be higher than in previous years. The proportion of non-subscribing customers has also increased somewhat, but this varies greatly from one company to another. Long-term companies generally have better results than the rest of the market.
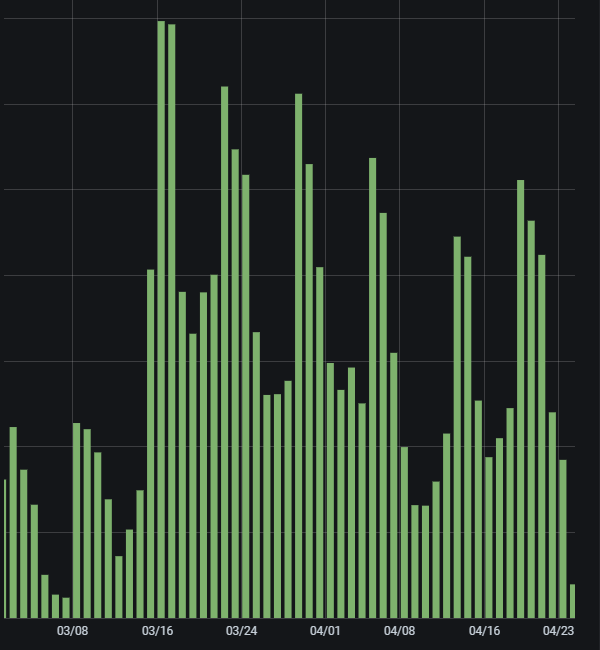
Not surprisingly, tour planning has been needed and used much more often. More information in this image:
The increase in the volume of emails is somewhat surprising. Obviously, the shop settings were also modified much more frequently to match the daily activity. Paypal also worked well with us:
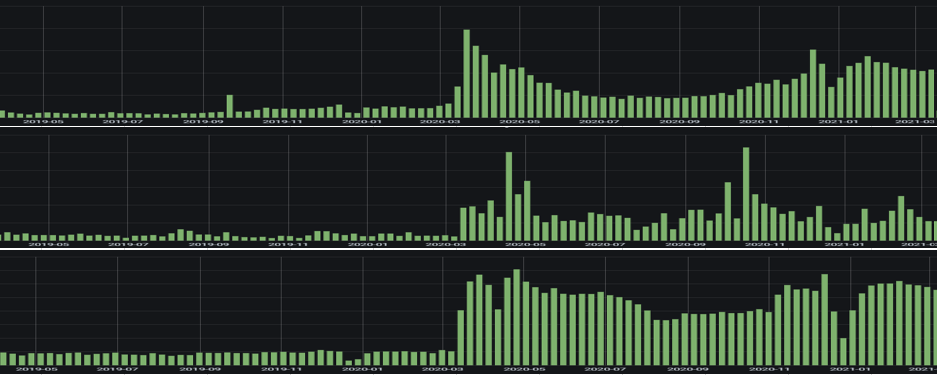
From March 2019 to February 2021.
During this period we had to rebuild a large part of the infrastructure, so we can keep making progress.
You can find more statistics in the PCG or in the admin area of the shop.