Here are some key figures from 2016, which help us to monitor our services and assess the quality of our services.
At 3.47 million customer meetings, there were 1.47 million order changes and 0.6 million new orders – and also 0.28 million cancellations.
Approximately 10 million emails were delivered, with a very high delivery rate.
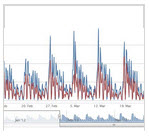
The number of incoming problem reports (we count *each* mail from you per end customer) has risen absolutely in 2016, mainly due to a slow system in March and problems on a weekend in October (“t-online”) and November. Although the original problem was never with us, our systems were unfortunately not yet “elastic” enough to cushion it.
However, the number of problem reports has decreased in proportion to customer meetings (from 0.06‰ to ~0.04‰, with a maximum of 0.5‰ at the beginning of November)
Overall, growth in all shops was weaker than in previous years, with a slight increase in the size of the shopping basket.
Tip: Statistics can be found in the admin area, under the main point “Statistics” and some comparative values also in the area “Current State”.